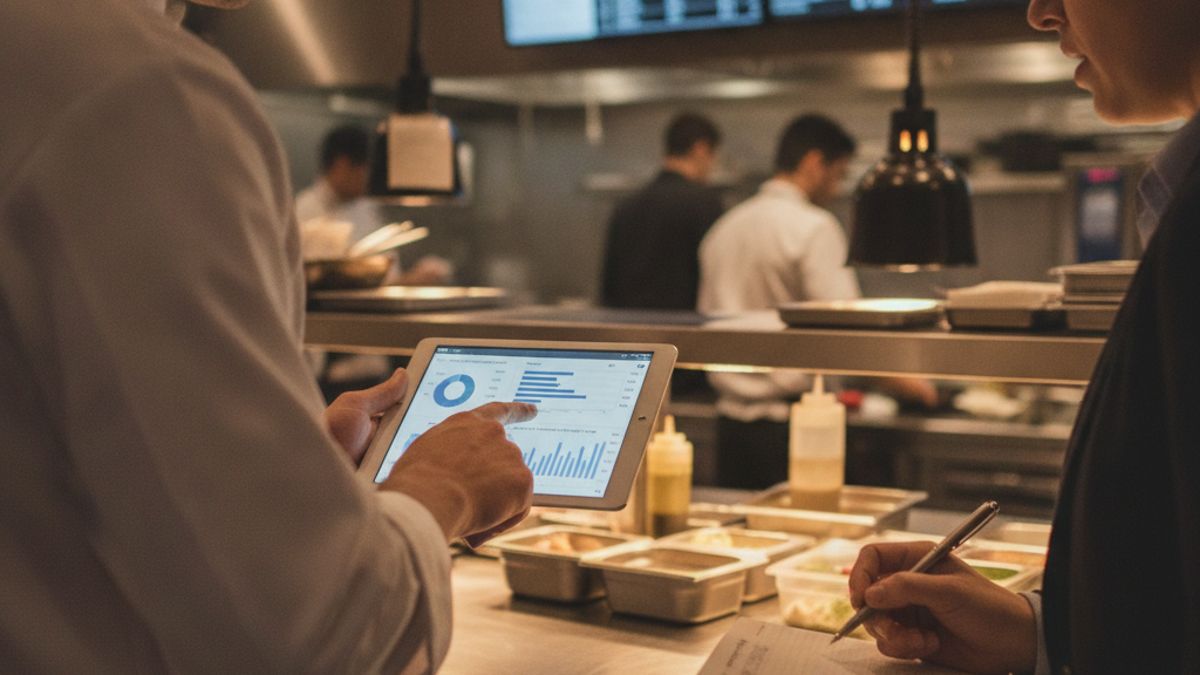
Weekly restaurant KPIs: what independent owners must track for profitability
Running a successful restaurant takes much more than serving great food and delivering excellent hospitality. It requires a firm and constant grip on your numbers. For many independent operators, the daily pace of the business moves so fast that analysing data feels like an impossible luxury. You might check the till at the end of the night, but raw sales figures do not tell the whole story. Understanding your restaurant KPIs (key performance indicators) is the difference between hoping for a profit and actively guaranteeing one.
Many owners wait until the accountant sends the monthly profit and loss statement before they review their margins. By the time you read that report, the money has already left your bank account. Tracking the right metrics on a weekly basis allows you to spot dangerous trends early and make fast operational changes. If food costs spike on a Tuesday, you can correct portion sizes by Thursday. If labour costs run too high over the weekend, you can trim the rota for the following week.
This comprehensive guide will break down the exact restaurant KPIs you need to monitor every seven days. We will skip the complex accounting jargon and focus purely on practical numbers. These are the actionable metrics that help you control your costs, increase your sales, and protect your hard-earned profit margins in a highly competitive market.
Contents
- Why weekly tracking beats monthly reporting
- The most critical financial KPIs to monitor every seven days
- Sales and revenue metrics for weekly review
- Customer experience and front-of-house KPIs
- Online ordering and delivery performance metrics
- How to automate your KPI tracking with modern tools
- Building a weekly review routine for your management team
- Conclusion
Why weekly tracking beats monthly reporting
A month is an incredibly long time in the hospitality industry. If your meat supplier raises prices on the first of the month, and you do not notice until the thirtieth, you have lost four weeks of potential profit. Monthly reporting is essentially a financial post-mortem. It tells you exactly what went wrong, but it offers the information far too late for you to fix the immediate problem.
Weekly tracking gives you the agility to react in real time. The restaurant business is highly volatile. Weather changes, local events, and unexpected staff absences can completely alter your financial reality from one day to the next. By shortening your review cycle to seven days, you maintain constant control over the steering wheel. You can make micro-adjustments to your operations before minor leaks turn into massive financial floods.
Furthermore, managing your metrics weekly removes the end-of-month administrative burden. Instead of spending ten hours trying to reconcile four weeks of confusing data, you spend thirty minutes reviewing a single week. When it comes to improving restaurant cash flow real time reporting is your greatest asset. It ensures you always have enough working capital to cover suppliers, rent, and payroll without last-minute panic.
The most critical financial KPIs to monitor every seven days
Financial metrics form the bedrock of your business. Without a clear understanding of what you spend versus what you earn, you are flying blind. Here are the core financial restaurant KPIs you must calculate and review every single week.
Prime cost
Your prime cost is arguably the most important metric in your entire business. It combines your total cost of goods sold (food and beverage costs) with your total labour costs. These are your two biggest expenses, and crucially, they are the expenses you have the most direct control over on a daily basis. You cannot change your rent mid-month, but you can change your staffing levels.
To calculate your prime cost, add your weekly cost of goods sold to your weekly gross payroll (including taxes and benefits). Most profitable restaurants aim for a prime cost that sits between 55 and 60 percent of total sales. If your weekly prime cost creeps up to 65 or 70 percent, you are losing money fast. Monitoring this weekly allows you to immediately cut back on unnecessary prep shifts or switch out expensive menu ingredients.
Food cost percentage
Food cost percentage tells you exactly how much of your revenue is being spent on ingredients. You calculate this by taking your beginning inventory value, adding your weekly purchases, subtracting your ending inventory value, and dividing the result by your total food sales. While doing a physical inventory count every Sunday night might sound painful, it is the only way to catch massive discrepancies.
A sudden spike in your food cost percentage usually points to one of three things. You might be suffering from poor portion control in the kitchen, excessive food waste, or employee theft. Many independent restaurant operators struggle with food costs because they only check them quarterly. Checking weekly ensures your chefs stay disciplined with their yields and recipes.
Labour cost percentage
Labour cost percentage tells you if your staff rotas are efficient compared to your actual sales volume. You simply divide your total weekly labour cost by your total weekly sales. A healthy labour cost percentage typically sits between 25 and 30 percent, depending on your service model. Fine dining will naturally have a higher percentage than a fast-casual venue.
Tracking this weekly is vital for schedule optimization. If your labour cost hits 35 percent on a quiet week, you know you overstaffed. You can immediately review the rota for the upcoming week and reduce shifts to compensate. This prevents a slow Tuesday from destroying your entire profit margin for the week.
Sales and revenue metrics for weekly review
While cutting costs is essential for survival, growing your revenue is how you actually thrive. Tracking your sales metrics helps you understand customer purchasing behaviour. It also highlights the effectiveness of your menu design and the performance of your front-of-house team.
Gross profit
Gross profit is the amount of money left over after you subtract your direct food and beverage costs from your total sales. Tracking this weekly ensures that your menu pricing strategy is still accurate. If your total sales look great but your gross profit is declining, it means the items you are selling are not priced correctly for the current cost of ingredients.
Reviewing gross profit by category can be incredibly revealing. You might find that your wine sales are generating massive profits, while your complex seafood dishes are barely breaking even. This weekly insight allows you to run specials on high-margin items to boost your overall bottom line.
Average order value (AOV)
Average order value, often referred to as average cover in a dine-in setting, shows exactly how much an individual guest spends during their visit. You calculate this by dividing your total weekly sales by the total number of guests served. This is one of the most direct indicators of your team's upselling abilities.
If your AOV drops unexpectedly, your waitstaff might need a refresher course on suggestive selling. Simply training your staff to recommend a premium side dish or a second round of drinks can increase your AOV by a few euros per head. Over a week, that small increase compounds into significant additional revenue without requiring any extra marketing spend.
Revenue per available seat hour (RevPASH)
RevPASH is a slightly more advanced metric, but it is critical for dine-in restaurants. It measures how efficiently you are monetising your physical dining room space. You calculate it by dividing your total revenue by the number of available seats, multiplied by the number of hours you are open.
This metric highlights the dead zones in your week. If your RevPASH is incredibly low on Wednesday afternoons, it might be time to introduce a targeted happy hour promotion or a set lunch menu. Conversely, a high RevPASH on Saturday nights means you are maximising your space, and you should focus entirely on table turnover speed.
Customer experience and front-of-house KPIs
Your financial metrics tell you what is happening with your money, but your operational metrics tell you why it is happening. The speed and quality of your service directly impact customer loyalty. Tracking these front-of-house indicators weekly helps you maintain a high standard of hospitality.
Table turnover rate
Table turnover rate dictates how many times you can reuse a table during a specific service period. A fast turnover means more revenue, but rushing guests will ruin their experience and damage your reputation. Weekly tracking helps you find the perfect operational balance for peak hours.
If your turnover is too slow, you need to investigate the bottleneck. Are the kitchen ticket times too long? Are the servers taking too long to drop the bill? Modern POS systems can track the exact lifecycle of a table, helping you pinpoint exactly where the delays occur so you can coach your staff accordingly.
Discount and void percentage
Your discount and void percentage is a massive red flag for underlying operational issues. A high number of voided items usually points to kitchen errors, poor front-of-house communication, or a training deficit. In worst-case scenarios, excessive voids can indicate staff theft.
You should calculate what percentage of your total sales was lost to voids and comps every week. If this KPI spikes during a specific shift, you know exactly which team members you need to speak with. Consistent monitoring ensures your staff remain accountable for their order accuracy.
Guest retention and repeat visits
Acquiring a new customer costs significantly more than retaining an existing one. If you have a loyalty programme integrated into your POS, you should track how many of your weekly orders come from returning guests. A steady drop in repeat customers is an early warning sign that your food quality or service standards are slipping.
Online ordering and delivery performance metrics
For modern independent restaurants, off-premise dining is a crucial revenue stream. However, delivery economics are notoriously tricky. High order volume means absolutely nothing if commission fees are wiping out your profit margin. You must track your delivery metrics with extreme discipline.
Delivery profit margin
You cannot look at online sales in a vacuum. You must calculate your true profit margin after all third-party commission fees, packaging costs, and delivery charges are deducted. Many owners are shocked to discover they are actually losing money on certain delivery platforms once all the hidden costs are factored in.
Monitoring this weekly allows you to push customers toward more profitable channels. This is why having your own white-label ordering system is so powerful. It allows you to bypass the aggregators entirely. Tracking the split between third-party apps and your direct commission-free channel is essential for long-term survival.
Order accuracy rate
Order accuracy directly impacts your customer retention and online reviews. Missing items lead to automatic refunds, angry phone calls, and negative social media comments. In the delivery space, there is no waiter available to quickly fix a mistake. The order must be perfect the first time.
Track the number of reported missing items or wrong orders weekly as a percentage of your total delivery volume. If the error rate climbs, you have a packaging or ticketing problem. A solid kitchen display system (KDS) can drastically improve this metric by eliminating lost paper tickets and forcing staff to verify every item before the bag is sealed.
Prep time and delivery handover
Customers expect hot food delivered fast. If your kitchen gets overwhelmed and prep times stretch to an hour, your cancellation rate will skyrocket. You must monitor your average ticket time for delivery orders separately from dine-in orders.
Tracking the handover time is equally important. How long does a bagged order sit on the counter waiting for a courier? If this number is high, you are serving cold food. Synchronising your kitchen prep with courier arrival times using smart technology solves this issue instantly.
How to automate your KPI tracking with modern tools
Tracking these restaurant KPIs manually with spreadsheets and calculators is tedious, time-consuming, and highly prone to human error. Independent owners already work long hours; you do not need to add data entry to your plate. You need technology that does the heavy lifting for you.
This is where all in one restaurant management platforms completely change the game. A modern cloud system integrates your sales data, inventory counts, and staff rotas into a single, unified dashboard. You can view your prime cost in real time without digging through piles of physical receipts or waiting for your accountant.
For an in-depth look at how upgrading your technology stack transforms your operations, read our guide on Cloud-based vs legacy server POS: a complete comparison for independent European restaurants. Modern systems automatically calculate your labour percentage, track your voids, and highlight your top-selling items with zero manual effort.
Automated reporting delivers these vital insights directly to your smartphone. You can monitor your business from anywhere in the world. See exactly how this remote capability works in our detailed article on Running your restaurant remotely: how cloud-based mobile dashboards give independent owners their time back.
Building a weekly review routine for your management team
Data is completely useless if you do not look at it and act upon it. To truly benefit from tracking restaurant KPIs, you must establish a strict weekly routine for reviewing the numbers. Monday morning is usually the best time for independent operators to assess the previous week, as the weekend rush is over and the new week is just beginning.
Set aside thirty minutes before the restaurant opens to review your dashboard. Look at your prime cost, your labour percentage, and your void reports. Identify the highest and lowest performing days. Once you have digested the data, hold a brief, fifteen-minute meeting with your head chef and your front-of-house manager.
Use this meeting to discuss actionable adjustments. If food costs are high, ask the kitchen to weigh expensive proteins carefully. If labour was too expensive on Wednesday, adjust the upcoming rota accordingly. Consistent, small adjustments compound into massive profit gains over a year. You can learn more about building a data-driven culture in our post on Restaurant analytics: how independent operators can use data to fight inflation.
Conclusion
Taking control of your restaurant KPIs does not have to be an overwhelming task. By shifting your focus from delayed monthly statements to real-time weekly insights, you protect your margins and drastically improve your operational efficiency. Start by mastering your prime cost, and gradually introduce more metrics into your routine as you become comfortable with the data.
You do not need an accounting degree to run a profitable venue; you just need the right tools. Tayim provides everything you need to track these numbers effortlessly. Our zero-commission, all-in-one platform offers an intuitive POS, a smart KDS, and robust analytics designed specifically for European independent operators. Say goodbye to manual spreadsheets, eliminate hidden fees, and start making confident, data-driven decisions for your business today.
Why Tayim?
- Zero commission - we take no percentage of your orders, unlike Glovo or UberEats which charge 15-30%
- All-in-one platform - POS, KDS, online ordering, delivery management, and analytics in one system
- Transparent pricing - free plan available, Solo at EUR 39/month, Multi at EUR 119/month
- Fully white-label - your customers see only your brand, not ours
- Custom on demand - we adapt the platform for any language, country, or specific need
Ready to modernize your restaurant?
Discover how Tayim can simplify your operations and eliminate commissions.